Value view
With this service, you can see the daily movement of the share price along with one or more key metrics or reported values.
The historical development gives you a better understanding of how the company has performed or been valued.
You also have a DCF beräkningen that can indicate whether the company is overvalued or undervalued depending on your assumptions about the future.
Overview
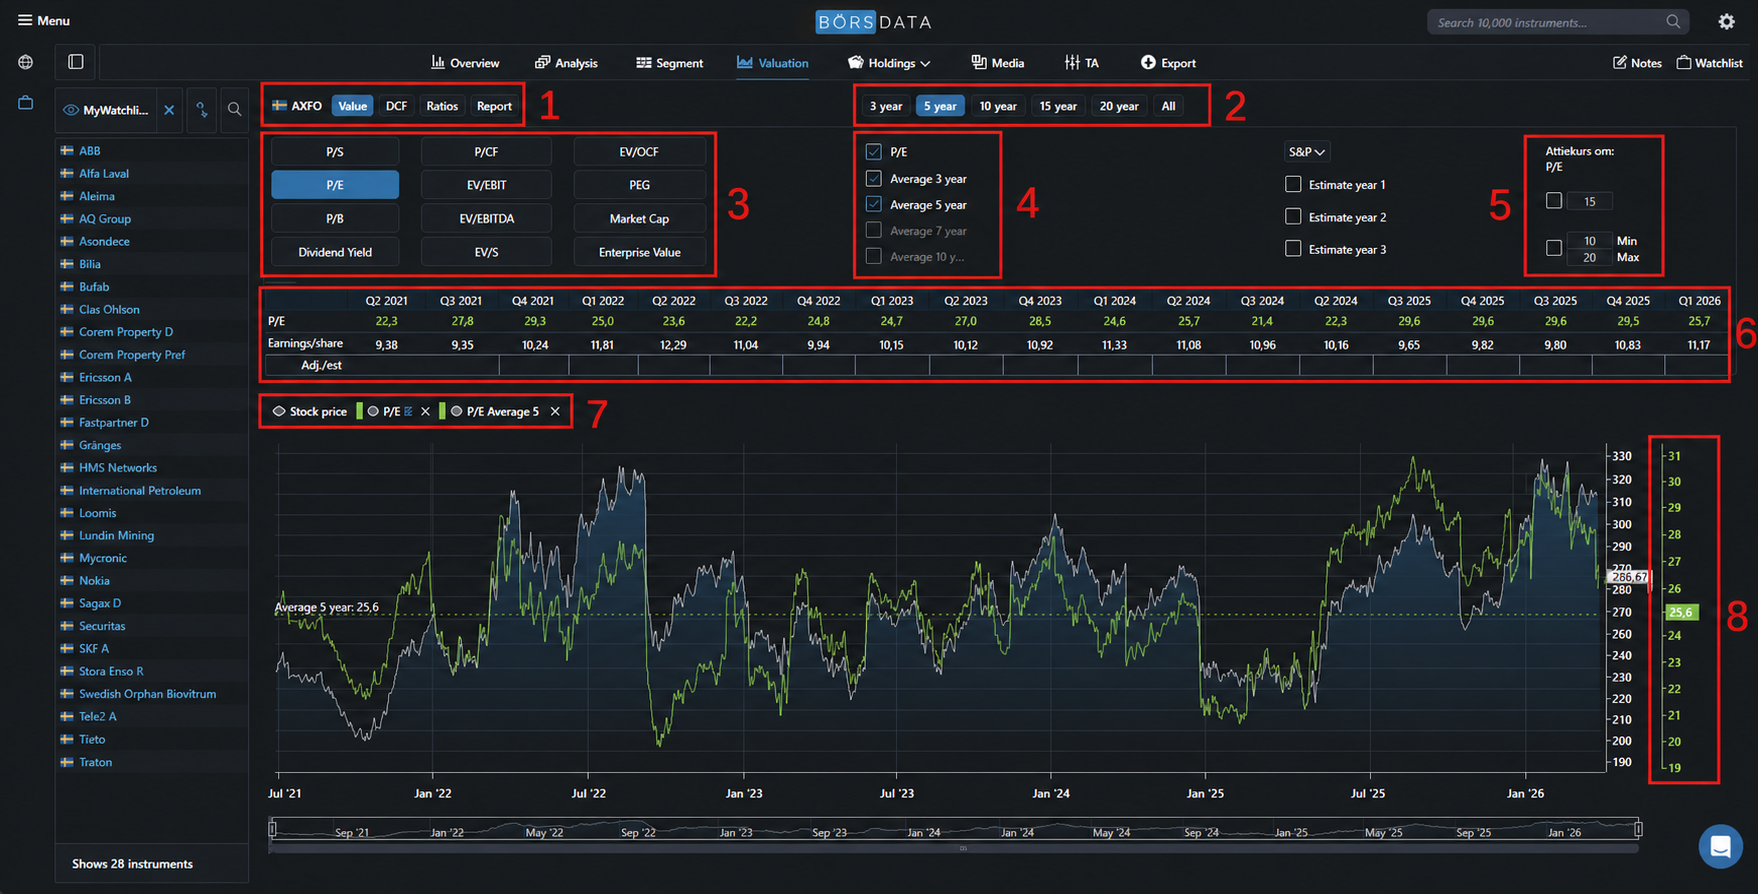
(1) At the top, you will find four different tabs with various calculations, and (2) you choose which time period you want to work with. (3) Each tab contains a number of key metrics, and you choose (4) whether you want to view the calculated metric or an average value. (5) You can convert valuation into a share price, i.e., what this stock would cost today given a specific valuation. (6) History. You can see the reported values that the metric is based on. Here, you can also adjust the value if you believe it is misleading. (7) A list of values displayed in the chart. You can hide a value, merge an axis, or remove a value. (8) Y-axes. Each value creates its own axis. The color of the line shows which axis it belongs to. You can merge multiple axis into one (see 7).
Need more information about these images. Are use case specific and I dont have a good enough grasp of this. Every thing below does not exists in the swedish version. Swedish images also needs to be updated.
The valuation ratios in the valuation service are P/E, P/S, P/B, P/EBIT, Yield and P/FCF.
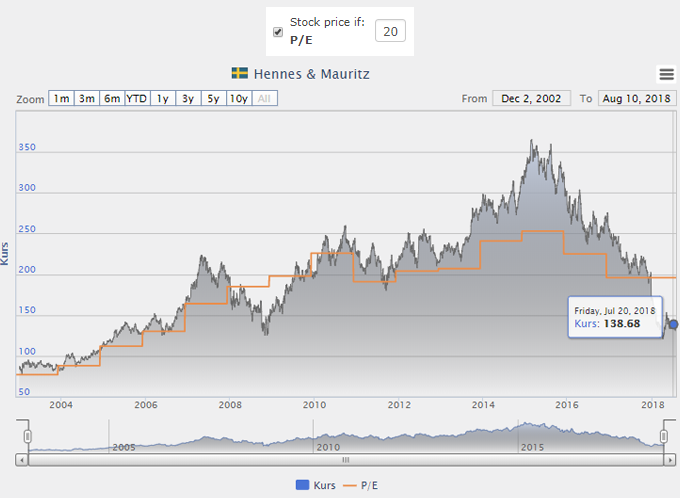
Convert valuation to share price
You can convert the rating to stockprice.
In the picture below, a share price of 138 SEK was required to receive a P/E of 20.
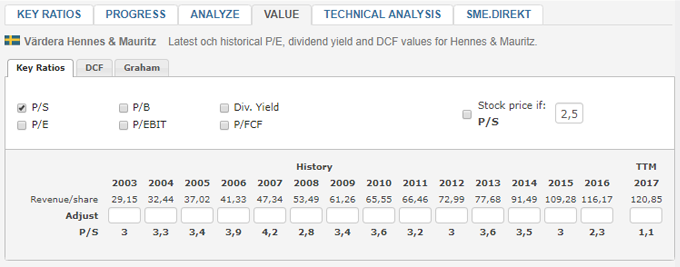
Adjust values for more accurate comparison
In many cases, the valuation ratios are affected by accounting effects, which makes it extremely difficult to compare historical developments.
Under Each key ratio there is an adjustment box that makes it possible to adjust off this effect.
By adjusting historical values to a more reasonable value, a more comparison bar valuation history is presented.