Analyze chart
Displays table data as a chart.
You can choose which values to display from the table [1].
Read more about the Analyze report data table
Chart overview
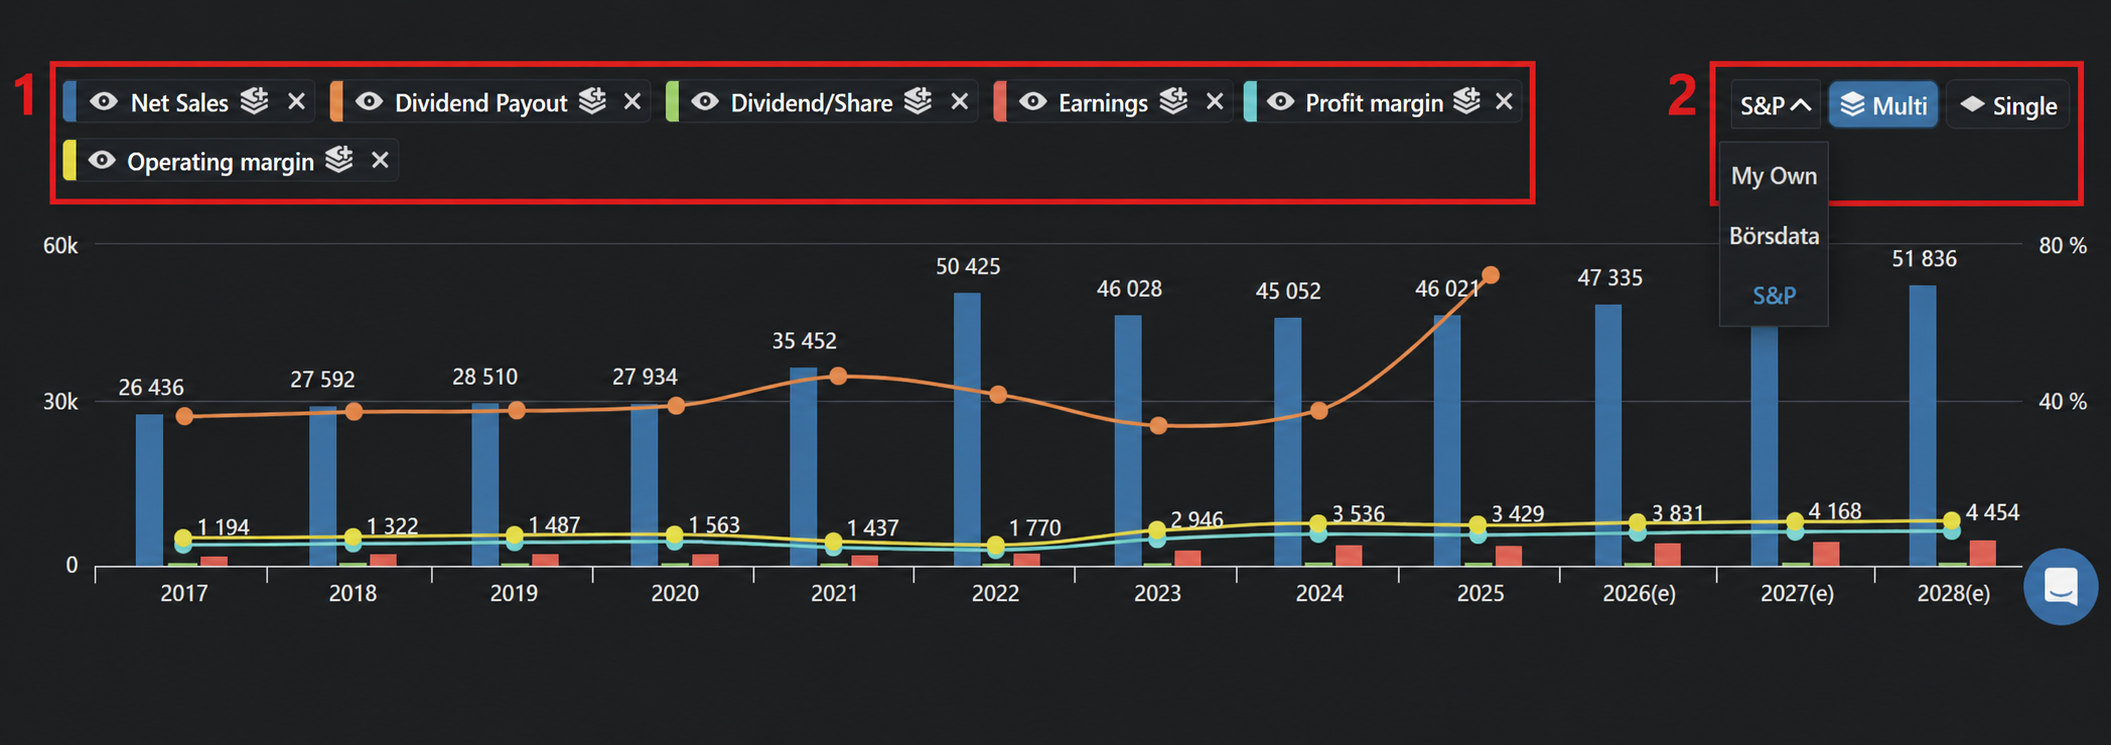
- Here you can show and hide values. You can also create a new chart axis or remove values.
Creating a new axis is good if you want to show small and large values in the same graph. The small values will not show well unless you create a new axis.
- Here you can select which source you want to use for estimate data if any exists. You can also select if you want multiple bars for the chart or single.