Kpi overview
The Kpi values on overview shows you the most important key figures. It gives you a quick and easy overview of the history of each key figure.
Key figures overview
The overview group is open to everyone, but the other four groups require Premium membership. Each key figure is clickable and opens compare industry.
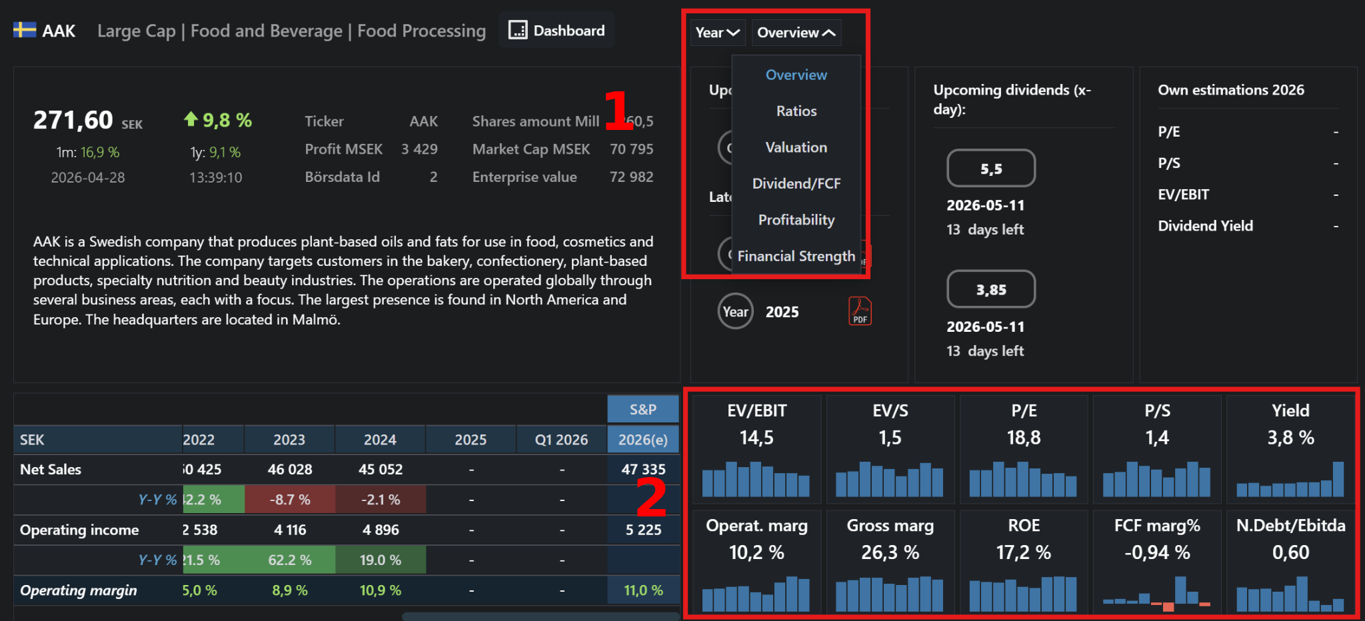
- The two dropdowns lets you select what type of key figures you are interested in and if you prefer to see year, rolling 12 months or quarters.
- Shows key figures, adjusted when you change settings in the above menu.
Click on a Key figure to open compare industry.
Up to 20 years of history for Pro
As a Pro member, you can opt for a review of 15 and 20 years worth of data.
Update of key figures
The key figures are updated quarterly in connection with when the companies release their interim reports and financial statements.
Share prices are updated daily. This always provides current and updated key figures. The latest key figure value is always calculated on a trailing 12-month basis. This means that it is calculated on the basis of the four latest rolling quarterly reports and the annual financial statement.
Links to all key metric descriptions
Overview
Valuation
Dividends & FCF
- Dividend
- Dividend Yield (%)
- Payout Ratio (%)
- Yield-on-Cost
- Total Dividend Yield
- FCF per Share
- FCF Margin (%)
- Capex (%)
- Dividend/FCF
- Earnings/FCF
Profitability
- Gross Margin (%)
- EBIT Margin (%)
- Profit Margin (%)
- EBITDA Margin (%)
- FCF Margin (%)
- ROE - Return on Equity (%)
- ROA - Return on Assets (%)
- ROA-G Return on Assets-G (%)
- ROIC (%)
- ROC (%)