Analyze company
The company's report data is the basis of fundamental analysis and is what drives the share price over time. The Analyze page shows the income statement, balance sheet, cash flow analysis and ratios, as well as the percentage development.
Choose whether you want to see report data for the full year, quarter or rolling 12 months. All report data for Nordic companies is obtained from us at Börsdata.
Overview
On the analyze page there is a table with report data and a chart where you can choose which values to display.
In the table you will find detailed report data and ratios with up to 20 years of history for the income statement, balance sheet, cash flow analysis and ratios per share.
Report table
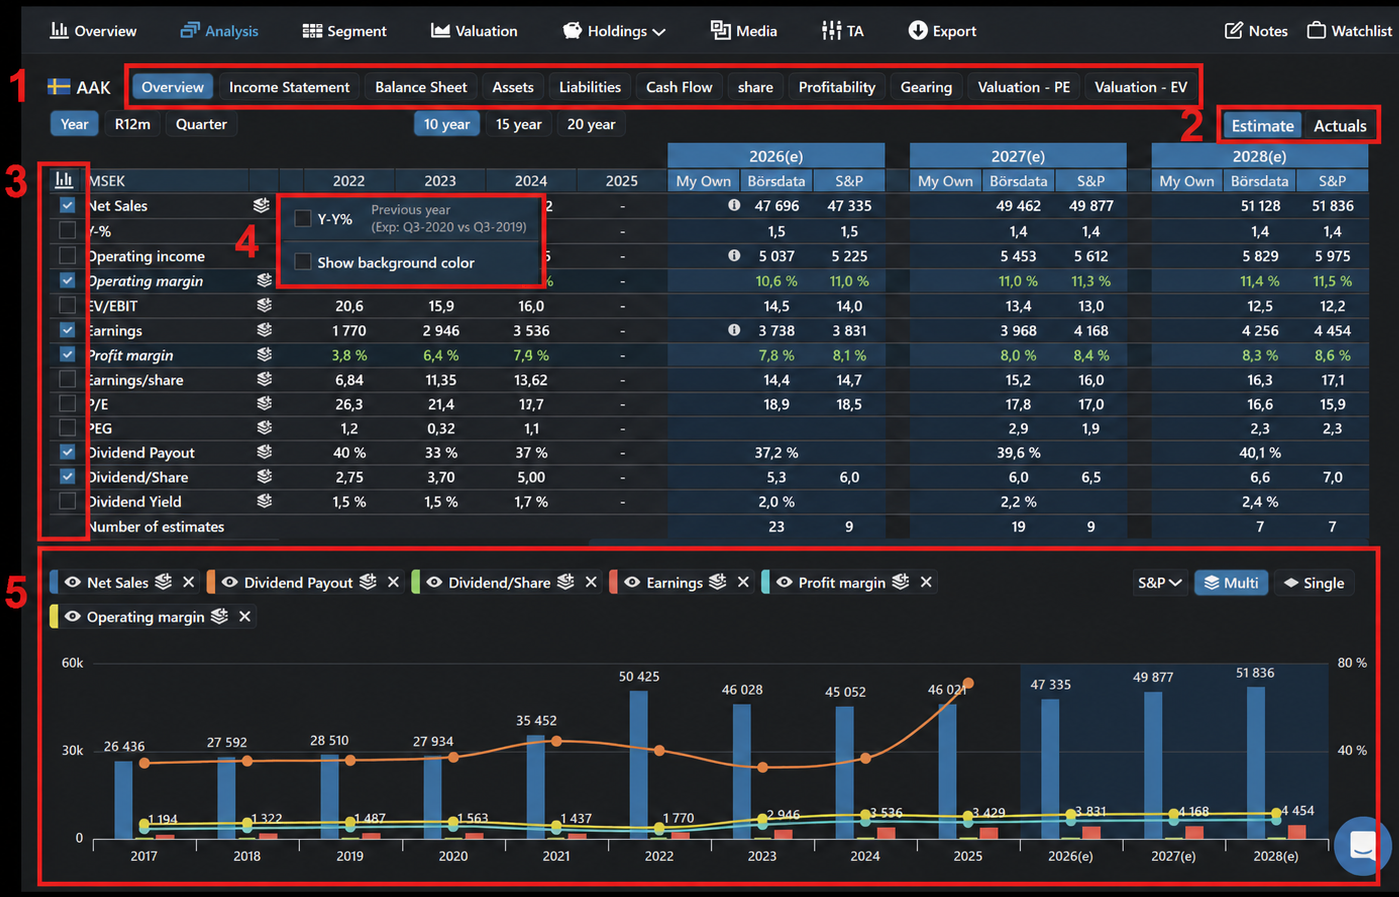
1. Report group
Here you can find different groupings of report data and ratios.
- Overview
- Income Statement
- Balance Sheet
- Assets
- Liabilities
- Cash Flow
- Per Share
- Profitability
- Indebtedness
- Valuation – P/E
- Valuation – EV (Enterprise Value)
2. Estimates & Actuals
User and Analytics Estimates for this company. Estimates show future predictions both by Börsdata users and from S&P. Actuals is the actual numbers a company has reported.
3. Select Ratios to show in chart (5)
4. Row menu
Add new row with Year to Year (%) or Quarter to Quarter (%)
5. Chart
Displays the values in a chart. You may decide what to see using the checkboxes in the row menu (4)