Progress View
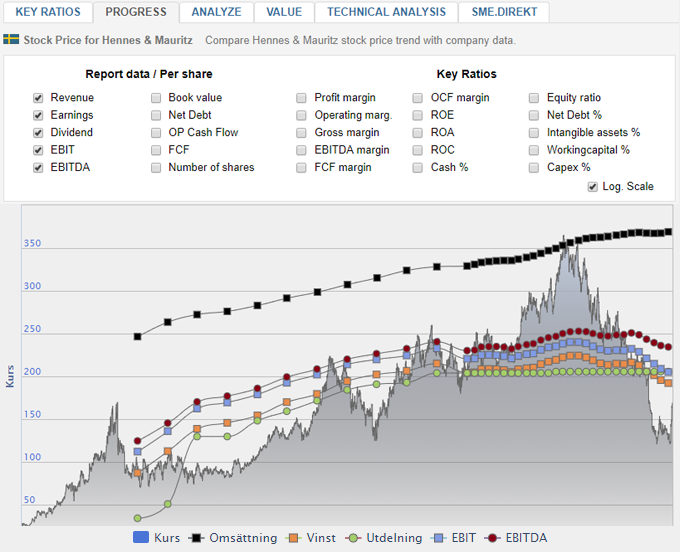
Under The development side, you can compare the historical stock price trend along with key figures and report Values.
You can choose from 25 key ratios with up to 15 years History.

It is possible to combine several different ratios on a single course chart by selecting the key ratios you are interested in.
Logarithmic scale
There is a logarithmic function to compare several different ratios at the same time.
The logarithmic function removes negative values.