Analyze financial data
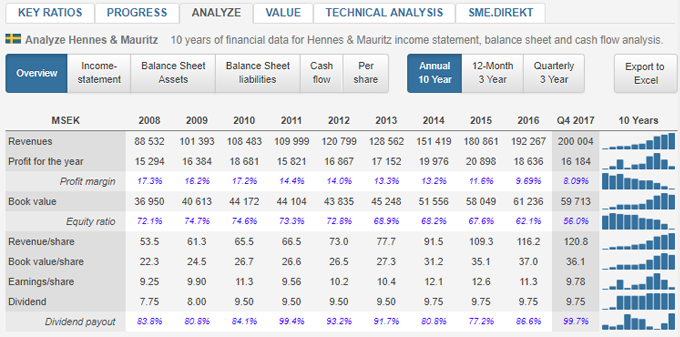
The analysis service allows you to see detailed report values and key ratios up to 10 years history of income statement, balance sheet, cash flow statement and key ratios per Share.
You can change the time period to rolling 12 months (R12) with 3 years history and the same for 3 years quarterly history.

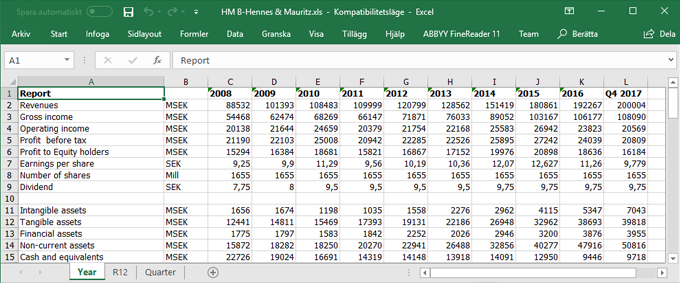
Export data to Excel
You can download full 10 year history, rolling 12 months (R12) and quarterly data directly to Excel for personal analysis.

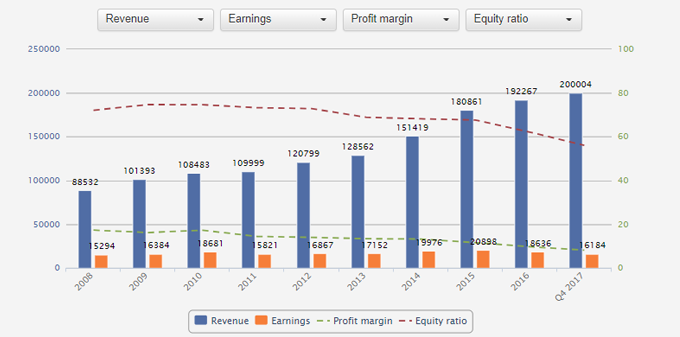
Detailed analysis of financial data
It is also possible to compare four key ratios in the form of two column charts and two line charts in the same table.

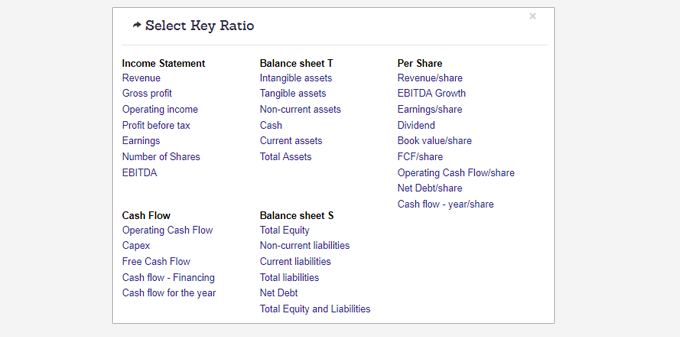
Select key ratios
There are 50 key ratios that can be selected and compared in the chart Tool.
